
Every day your dealership website quietly records what buyers do. Which cars they open, how long they stay on a listing, the vehicle they enquire about. Most dealers never look at any of it, yet it is the clearest reading of online interest you will ever get, far more honest than a hunch about what should sell.
This guide shows how to read that signal without becoming a data analyst. You will see which numbers matter, how to turn them into stocking and pricing decisions, and the mistakes that make people trust the wrong figures.
What your website already tells you about demand
Most of the information you need is already sitting in your website, unused. Each vehicle page counts how often it is opened. The contact form records which car triggered an enquiry. Your analytics shows whether someone spent two minutes on a listing or left after three seconds.
Picture a used Ford Focus and a used BMW 3 Series listed in the same week. The Focus page is opened forty times and draws two enquiries. The BMW page is opened ten times and draws none. Without any survey, your own site has shown you where the demand sits. The first step is simply to look at these numbers on purpose, rather than only checking whether the phone rang. None of it needs a new tool. The figures are already there, waiting for the habit of reading them.
Which signals reveal real online interest
Not every number deserves your attention. Page views tell you what attracts a click, but a much-visited listing with no enquiries is often priced wrong. Enquiries per vehicle are the strongest signal, because someone took the trouble to write. Time on the page and the share of visitors who scroll through every photo sit in between.
A practical example. A Volkswagen Golf is opened often, keeps people on the page for over a minute and collects regular enquiries. That is genuine online interest. A car that is viewed a lot but loses people within seconds usually has a price or photo problem, not a demand problem. Reading the two together stops you from drawing the wrong conclusion from a single figure. It helps to think of online interest as a conversation. Views are people glancing through the window, while enquiries are the ones who step through the door.
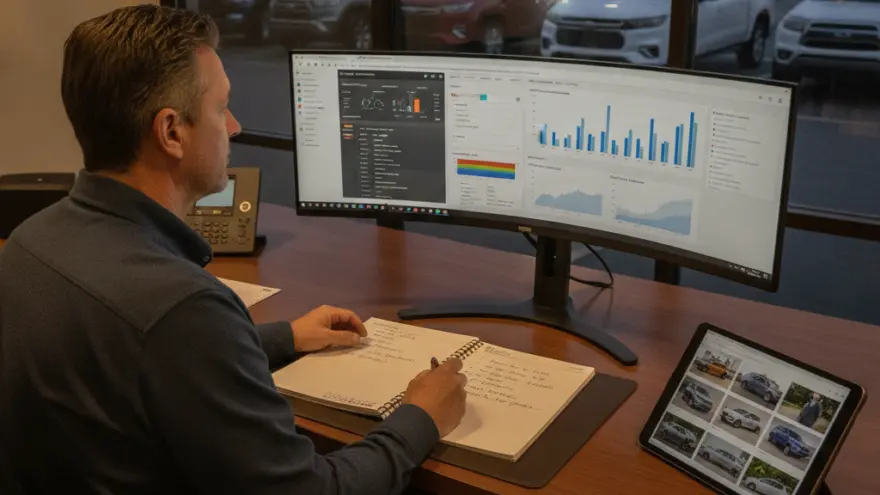
Interest per vehicle in one place
The ADP Car Market Hub WordPress plugin from AD Promotion records views, enquiries and time spent for every vehicle page on your own site. You see at a glance which cars draw attention and which sit untouched, and a signal that used to be invisible becomes a number you can act on.

Turning online interest into smarter stocking
The point of this is not a prettier dashboard, it is buying the right cars. When a certain model, age or price band draws steady attention, that is a hint to keep something similar in stock. When a category is viewed by nobody, you learn that before tying up money in it.
Take a dealer who notices that compact hybrids under fifteen thousand euros are opened twice as often as large diesels. At the next trade-in or auction lot, that knowledge guides the choice. To keep the cars people want visible and well organized online, see how to present your inventory online. Demand on your own pages is a better guide than a gut feeling, because it reflects what real visitors did, not what they said. Over a few months the pattern becomes hard to miss. You start buying to meet real online interest instead of habit, and the slow corners of the lot shrink.
Pricing with more confidence
Interest data also takes some of the guesswork out of pricing. A car that is opened constantly but draws no enquiries is often above what the market will pay. A car that sells within days of going live may have been priced too low and left money on the table.
Watch how online interest behaves after a price change. Drop the price of a slow Opel Astra by a few hundred euros. Then see whether enquiries pick up within a week. That small experiment tells you more than any list price. Keep it simple and change one price at a time, so you can read the effect cleanly. Clear, well-judged pricing also builds trust, which is the theme of how transparent pricing wins buyers.
From real use
A dealer kept a well-equipped station wagon on the lot for two months, with plenty of page views but not a single call. After moving to its own vehicle pages with the ADP Car Market Hub WordPress plugin, the owner could finally see that the car was viewed often yet never enquired about. A modest price cut followed, the enquiries arrived within days and the car sold the same month. The plugin was the trigger here, because the silent interest only became visible once the data sat on the dealer’s own site.
Mistakes that make you read the numbers wrong
Website data is useful only if you read it honestly. The most common trap is the small sample. Three views and one enquiry tell you nothing reliable, so wait for enough traffic before you conclude. The second trap is the vanity metric. The total visitor count looks impressive, but it says little if those people never reach a vehicle page.
A third mistake is ignoring where visitors came from. Fifty views from a one-off social media post behave nothing like fifty views from people actively searching for a car. A listing shared in a local group spikes for a day, then goes quiet. Read that as a burst of curiosity, not lasting demand, and you will stock accordingly. When a number surprises you, give it another week before you act. Real online interest holds steady, while a one-day spike fades.
Watch enquiries per view, not raw views
Raw view counts are easy to misread, because a single share can inflate them overnight. A steadier signal is the ratio of enquiries to views on each vehicle page. A car with forty views and three enquiries is performing far better than one with four hundred views and none, and that ratio quietly points you to the listings worth keeping, repricing or replacing.
A simple weekly routine that pays off
You do not need a data team to benefit from this. A short weekly habit is enough. Once a week, open your analytics and look at three things. Which vehicle pages drew the most views, which ones turned views into enquiries, and which cars have sat with high views and no contact for too long.
From that quick read, a few actions follow. Reprice or rephotograph the cars that get attention but no enquiries. Give your best performers a more prominent spot. Note which categories to look for at the next auction. Write the three findings in a notebook each week. Over a month, that short list quietly becomes a buying guide of its own. In 2026 this matters more than ever, because buyers research online for longer before they call, so your own pages hold the earliest sign of what they want. Twenty minutes a week turns scattered numbers into steady, confident decisions.
Conclusion
Your website is already telling you which cars buyers want, you only have to listen. Watch enquiries per vehicle, read views and time on page together, and let real online interest guide what you stock and how you price. Start small, with a weekly look at a handful of figures. The ADP Car Market Hub WordPress plugin from AD Promotion brings these signals together on your own domain, so the demand that used to stay hidden becomes something you can see and use. Decisions then rest on what buyers actually do, not on guesswork.
Sources
- Think with Google, research on how buyers use online research before visiting a dealer.
- Cox Automotive, the Car Buyer Journey study on online shopping behavior.
- Statista, market data on digital vehicle research and online buying.
Frequently Asked Questions
Do I need expensive software to see which cars get the most online interest?
No. Most of the signal comes from the basic analytics already running on your website plus the enquiry data from your own vehicle pages. A simple weekly look at views and enquiries per car is enough to start.
How many views does a listing need before the numbers mean anything?
There is no fixed figure, but a handful of views tells you little. Wait until a page has gathered enough traffic over a week or two, and always read views together with enquiries rather than on their own.
Are enquiries more important than views?
Usually yes. A view is only curiosity, while an enquiry is someone willing to make contact. A car with fewer views but steady enquiries is performing better than a much-viewed listing that no one contacts.
Can interest data really help me decide what to buy?
It points you in the right direction. If a model, age or price band draws steady attention and enquiries, keeping something comparable in stock is a reasonable bet. It is a guide based on real visitor behavior, not a guarantee.
How does this help with pricing?
A car with many views but no enquiries is often priced too high. Watching how enquiries react after a small price change tells you whether the market agrees with your price, far better than a fixed list.
Does this work for a small dealership?
Yes, and arguably better. A small business cannot afford dead stock, so reading early interest signals to avoid the wrong cars matters even more when every space on the lot counts.
How long before I see useful patterns?
Often within a few weeks. Once a handful of vehicle pages have collected views and enquiries, clear differences appear. The habit of a short weekly review is what turns those patterns into better decisions.